Since day one, we've been dedicated to industry-leading transparency into our business processes and performance. Review the charts and read the following article for insights into our book of business over the last month, as well as operational initiatives to continue to improve, grow, and provide extraordinary service to our customers.
July's Performance
In July, we originated 144 loans, totaling more than $49.4 million in origination volume.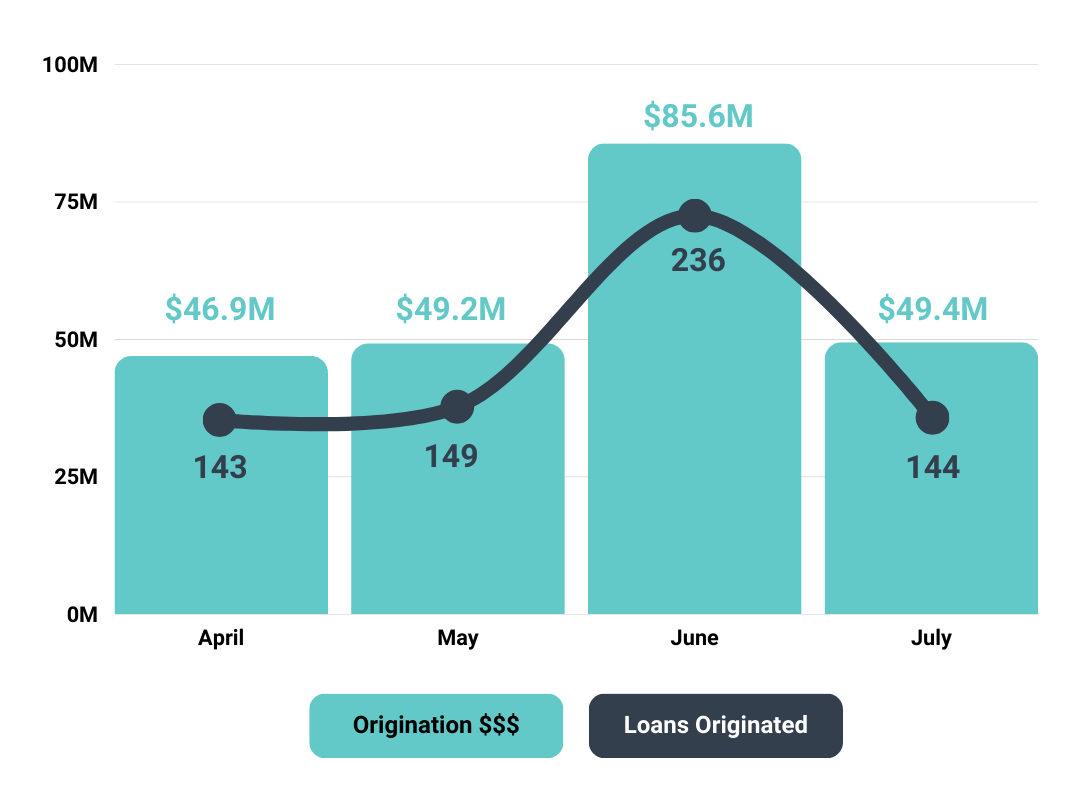
As of July 1, 12.1% of our total loan count was 31 days or more late on payments. As we post our Performance Reports a month after the just-ended month, we are currently reviewing August numbers and seeing an improvement on the count of delinquent projects. This momentum, the reduced number of new projects entering the delinquent population, and data on the analysis of our delinquent loans (second chart below) continue to paint the picture that this is a legacy problem caused by the short-term duration of our notes compared to longer foreclosure/default timelines, as well as the reduced volume of originations in Q1 2023 compared to payoffs that reduce our denominator in percentage calculations.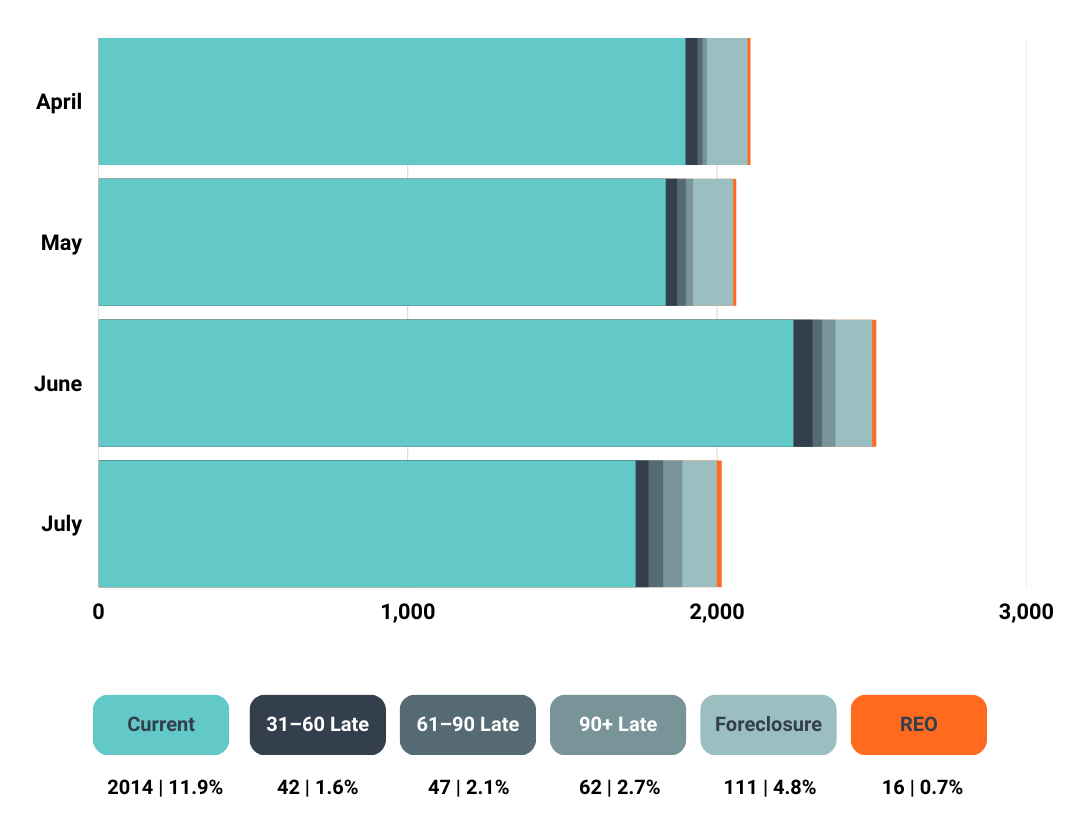
Historic delinquency rate from 2021: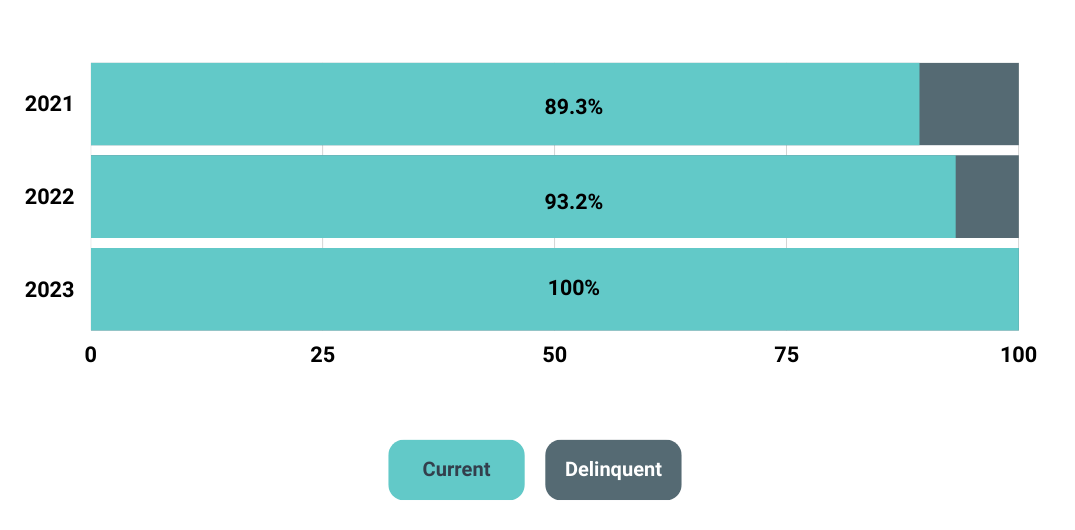
Passive Investments on the Platform
Moreover, in the month of July we saw:
- $24.92M in new investments across all retail investment offerings (Borrower-Dependent Notes (BDN), PFNF, RBNF) at a WAVG rate of 11% (not inclusive of HRIF which depends on July performance).
- $1.4M HRIF investments
- $16.695 BDN investments
- $7.26M series note investments (PFNF, RBNF)
- 1,820 total investments
- 10.4% average rate of return
- Total of $3,523,454.29 paid to investors in actual income, including:
- $3,263,081.72 in interest
- $39,978.23 in late fees
- $220,394.34 in extension fees
How We Present Our Data
As you can see in the charts above, we show you the total count of delinquent loans. This is to remain transparent on our business performance, but also to better align with the Mortgage Bankers Association's (MBA) standard, published in its National Delinquency Survey (NDS), which is based on loan count. However, the MBA classifies delinquency as loans that are 60+ days late on payments. We show you the count of delinquent loans from 31+ days to again, remain transparent.
The NDS states:
 The delinquency rates and foreclosure starts rate are seasonally adjusted to account for trends in the data that are caused by the time of the year. For example, delinquencies tend to increase from the first to fourth quarters, peaking in the fourth quarter, before falling in the first quarter of the next year and beginning the cycle again."
The data we share in our Performance Reports is not seasonally adjusted, but we feel it's pertinent to explain seasonal trends when applicable.
More Insight into Delinquencies
We are always focused on a successful exit to maximize the repayment of principal and speed to liquidity.
With foreclosures, unfortunately, we are at the mercy of county court systems working through lengthy foreclosure processes, or our borrowers exiting their projects. We know some of our delinquencies are strategic, as developers delay liquidity events of other projects for key buying seasons.
With the recent cooling of inflationary real estate figures, total days on market continue to come down to early 2022 levels, currently hovering around the 40 days mark, and home prices in most of our markets are continuing to climb back to mid-2022 numbers. This is in line with our thesis that — especially within our chosen operational geographies — there is a true housing supply shortage as household formations continue to significantly outpace housing inventory.
Other things affecting the performance of our book include:
- Changing availability and/or terms of capital for refinancing or end-buyer financing impacts exit timelines and monthly payments.
- Several high-dollar loans remain delinquent on payments (with priority on exit and repayment).
- Continued supply chain issues and labor shortages contribute to construction delays and eventually, delinquencies.
What We're Doing
As always, we're actively working with our borrowers to keep their projects moving forward, on track, and current on payments. We have recently restructured the lending side of our business in order to ensure portfolio performance is our top priority.
- Self-service tools to make it easier for borrowers to request draws, payoffs, and more.
- Our Account Management and Sales teams work closely with each other and borrowers to ensure payments and projects are current before proceeding with new loans for the same client.
- Additionally, the Account Management team works diligently to ensure as few loans as possible remain delinquent longer than 30 days.
- Updated, more efficient processes to review delinquent accounts and issue notice of default communications sooner.
We're also continuing to build a strong forward pipeline even in a somewhat uncertain real estate market, remaining selective on markets to enter and what projects we fund by focusing more on appraisals and historic performance. The Upright operational and business strategy is designed around utilizing a diverse capital stack so we're always positioned to weather market volatility and come out ahead.
If you have any questions or would like to provide feedback, email us at invest@upright.us. We will respond as soon as possible.
Log in to your account here, or start investing.